
How community-name search turns noisy listings into clear decisions
Most real estate portals still start where people don’t: city or ZIP. Homeowners and residents think in buildings and subdivisions—the micro-markets where rules, fees, stacks, views, and amenities actually shape price. That mismatch is why “comps” often feel like guesswork: two condos across the street can look similar on paper yet live in different markets.
Subdivisions.com flips the workflow. We index listings to exact subdivision and building boundaries, unify local nicknames under a single canonical page, and surface the context that matters—so your comp set is truly comparable.
What “apples-to-apples” means here
Apples-to-apples is a comp set drawn from the same community boundary with the same amenity profile and, when relevant, the same stack/line and floor band. It’s a narrow, honest slice—not a city-wide collage.
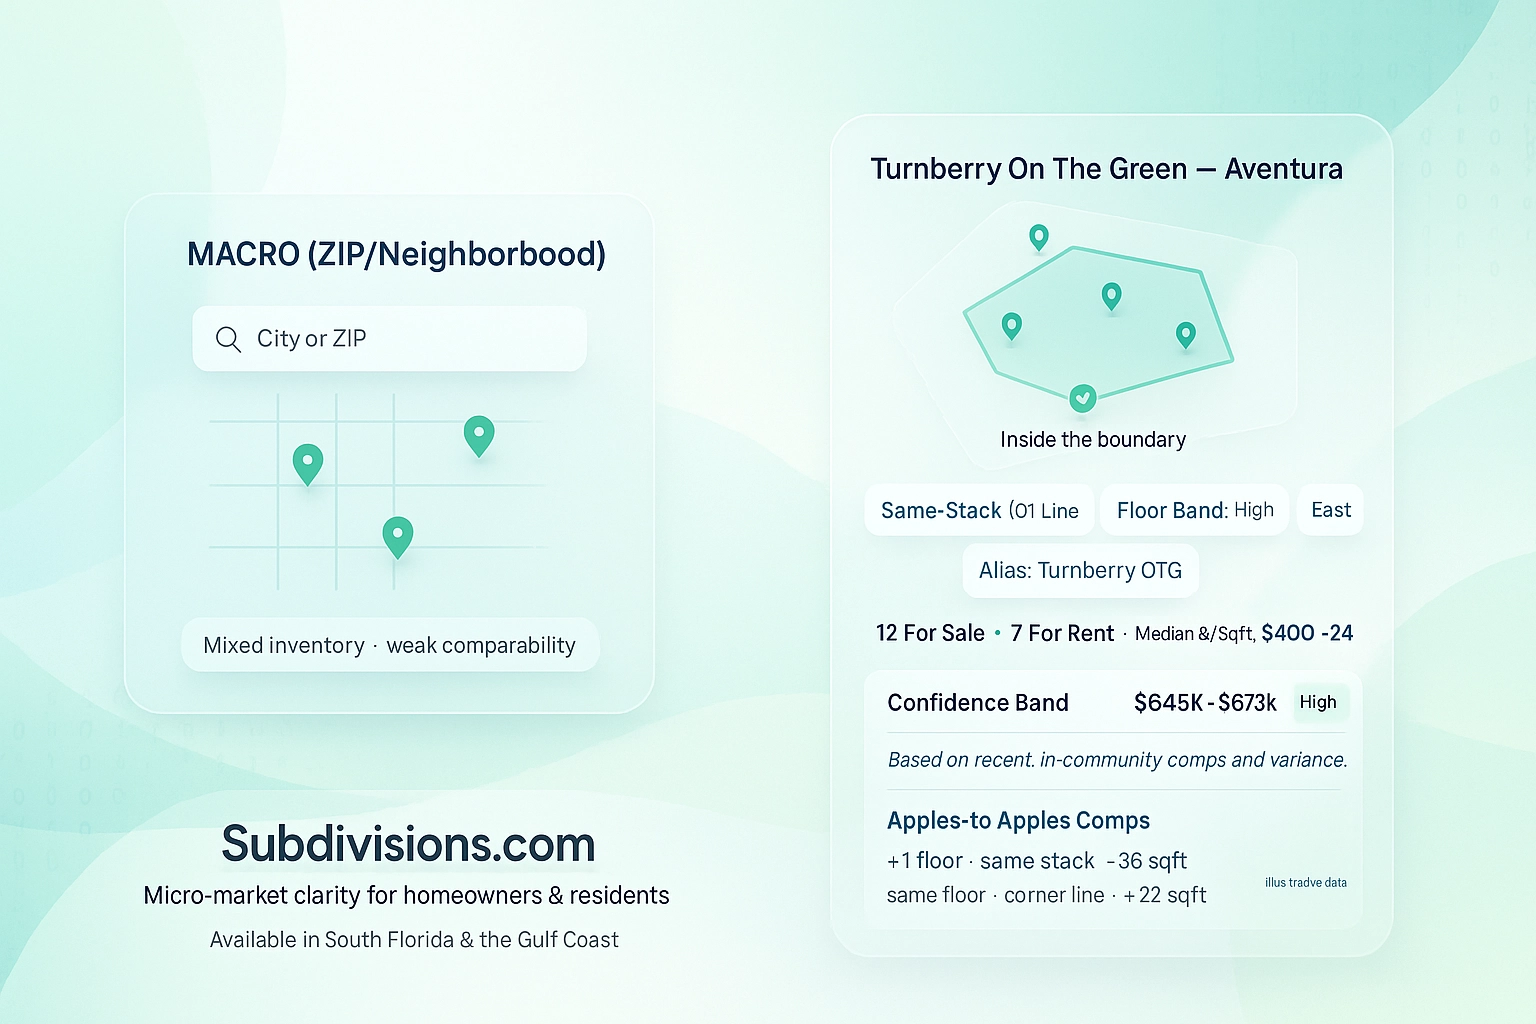
On each community page you’ll see:
Complete, in-boundary inventory (for sale and for rent).
Median $/SqFt plus a distribution band to show spread, not just a single number.
Recent, in-community comps with quick “why it’s comparable” notes (size, floor, exposure, renovation hints).
Policy and cost signals homeowners care about: HOA ranges, rental rules, special-assessment flags when available.
The result: fewer “nearby look-alikes,” more true peers.
Why ZIP and neighborhood averages fall short
Neighborhoods and ZIP codes are macro-markets. They mix product types, HOA regimes, rental policies, and amenity sets. That’s fine for orientation; it’s weak for pricing. In high-density condo areas, boundary lines matter. A tower with strict rental rules and full amenities prices differently from the one across the street with flexible rentals and modest facilities—even if the numbers look similar at a glance.
Near isn’t in. We lock results to the actual community polygon or building address to avoid mixing inventory that doesn’t belong in your decision.
Confidence, not certainty
Valuation isn’t a magic number. We publish a confidence band—for example, “$645K–$673K”—and explain why:
Comp similarity (beds, baths, size, exposure, floor band)
Recency (how recently similar units closed)
Volatility (spread of $/SqFt in the last 90 days)
Community activity (active inventory, DOM patterns)
High confidence means a tight band with recent, close matches; lower confidence tells you to widen the lens or request a human CMA. The goal is transparency, not theater.
Practical workflows residents actually use
“I live here—show me everything here.”
Type your community or building name. You’ll get only in-boundary results, then refine by stack/line and floor band.“Units like mine.”
Filter to your line/exposure and similar square footage to see near-identical peers—fast.“I’m buying a second unit to rent.”
Switch on rent signals (where available): typical rent comps, HOA ranges, and occupancy patterns—inside the same community, so yields aren’t distorted by macro noise.“What changed this week?”
A simple digest of new listings, pendings, closes, and price changes in your building—no city-wide scroll.
How the data is structured (plain English)
Subdivision-mapped boundaries. Each community has a maintained polygon or building ID; listings are attributed to the right side of the line.
Alias resolution. Local nicknames (and misspellings) roll up to one canonical community page, so residents don’t miss inventory.
Micro-attributes. Stack/line, floor bands, exposure, and amenity parity help separate true peers from look-alikes.
Context baked in. Median $/SqFt with spread, recent comps, fee ranges, rent policies where available, and time-on-market patterns.
This is what we mean by high-fidelity, in-boundary data.
A simple way to judge clarity (and speed)
If you want to compare experiences, try one task both ways:
Task: “Show all active listings in your building.”
ZIP + filters: multiple steps, keyword guessing, stray results.
Community-name search: one query → complete, in-boundary inventory.
We describe this as being faster to the answer—not because pages load quicker, but because the data model removes detours. When we publish formal benchmarks, we’ll share method and medians so anyone can reproduce the result.
Where it’s live—and why
We’re focused on South Florida and Florida’s Gulf Coast first. High-quality coverage—naming integrity, boundary accuracy, and regular QC—beats racing to national scale. We’ll expand market by market with the same standard.
What this means for homeowners and residents
You start where you live: by community name, not ZIP.
You see everything inside the boundary, not educated guesses.
You compare true peers with the context that changes price.
You get a confidence band and the reasons behind it.
Apples-to-apples comps aren’t a slogan. They’re the foundation for clear decisions—whether you’re pricing to sell, buying a second unit, or simply tracking your building.
Subdivisions.com is available today in South Florida and Florida’s Gulf Coast. Type your community name to see what’s inside your boundary.


Comments